Why Bayesian Statistics
It is hard to describe the benefits of Bayesian statistics. So let me show them by describing a problem I solved using Bayesian statistics, which would be hard to solve with traditional statistics.
The problem
When COVID struck, Enveritas helped governments measure how fast the disease was spreading.
Since this was early in the COVID pandemic, there wasn’t a lot of data about how widespread COVID-19 was in Ethiopia, rural areas, and Africa in general. Without data, governments couldn’t decide: should they lock down?
To do this, we decided to use antibody tests. Knowing how many people have antibodies against COVID-19 is a good way to know how many people got infected. And if we do these tests weekly, we should be able to track the speed of infection.
The base rate fallacy
But we had a huge problem: antibody tests are not perfect. Far from it.
Every antibody test has a chance of having fluke results. They can make two types of errors:
- False positive: the test says a person without antibodies has antibodies
- False negative: The test says that a person with antibodies doesn’t have antibodies
False positives matter more here, and I’ll show why.
To simplify, assume a test with no false negatives. Everyone that has antibodies will get positive results (0% false negative rate)1. On the other side, the test will have a 5% false positive rate (5% of people without antibodies will get a fake positive result).2
Ok. We test a random person and the test comes back positive. How likely is it that this person has antibodies for COVID?
Most people think the answer is 95%. The reasoning is “if there is a 5% false positive rate, then there is a 5% chance the result is a fluke”.
This reasoning is wrong. And this mistake is what we call the base rate fallacy.
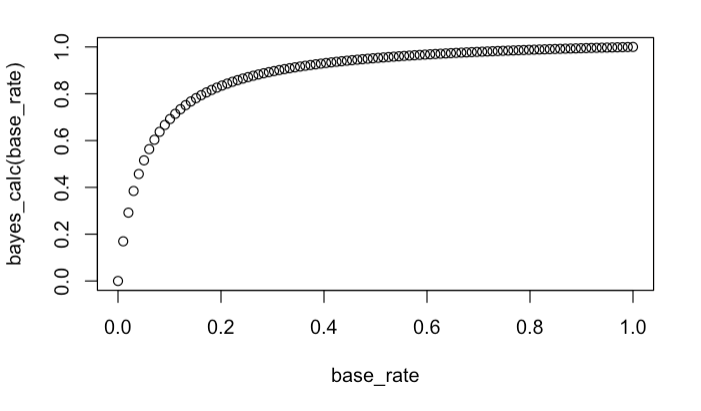
The truth is that the answer depends on another variable: what percentage of the population has antibodies.
If 50% of the population have antibodies, then it is true that you have a 95% chance of having antibodies after a positive test. But if it is 2% (like it was early in the pandemic) this probability drops to 29%. A completely different story.3
This isn’t just a problem for individual diagnoses. When you’re trying to estimate how many people in a city or country are infected, the same logic applies to your entire batch of test results: if the base rate of the disease is low, most of your positives are noise.
Why this happens
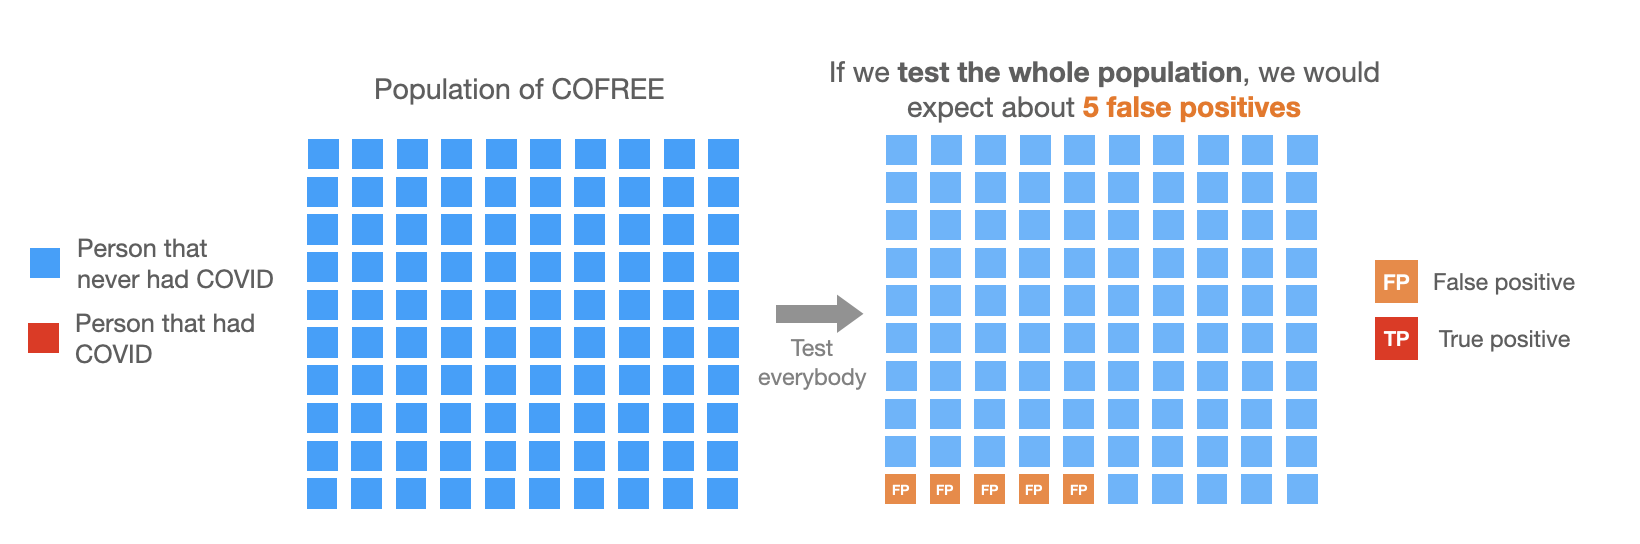
Imagine a population of 100 people from an island called COVIDFREE, where COVID never arrived. If we were to do our test there we would expect about 5 positive tests (which would all be false positives) and 95 negatives.
Week 1:
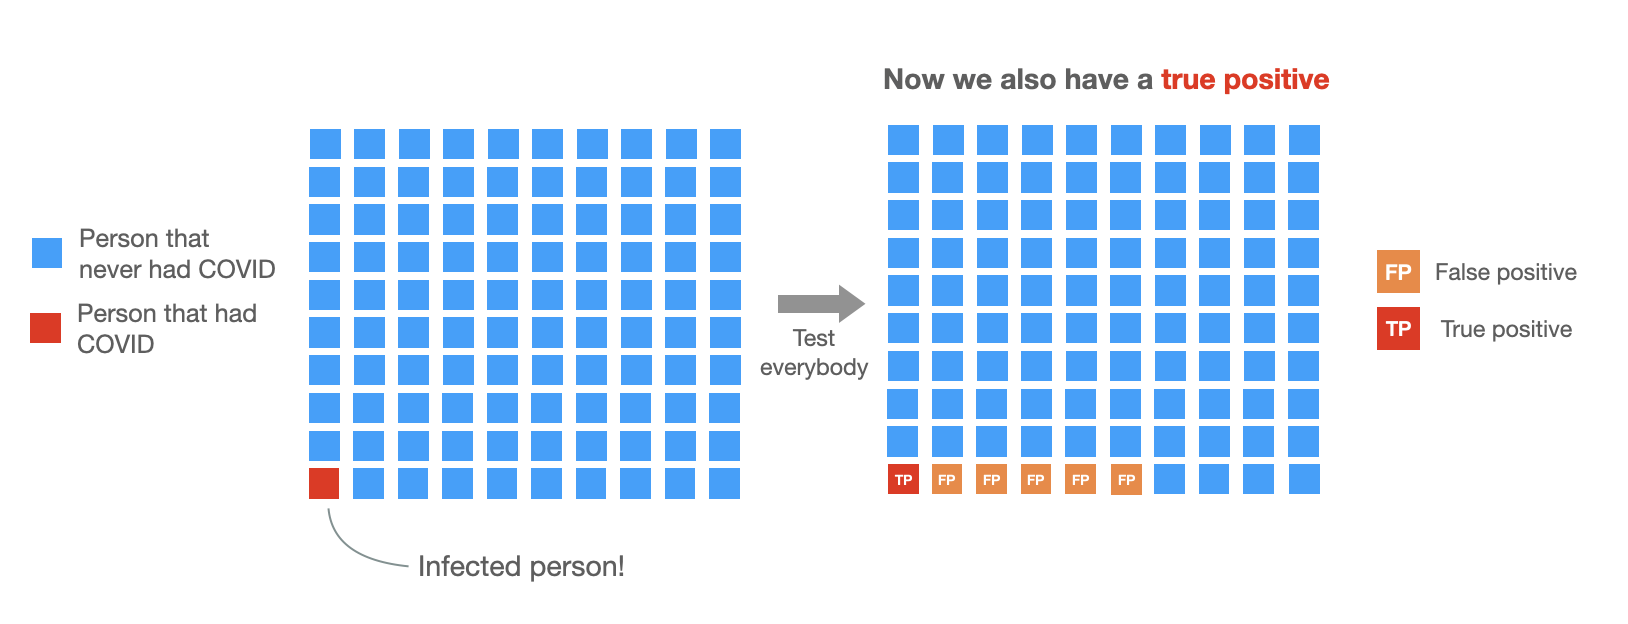
In week 2, one person gets infected. Now 1 in 100 people have COVID, so we expect about the same number of false positives (5% × 99 ≈ 5) and the test also comes back positive for the person with COVID. So now we will have 6 positive cases: 5 false positives and one true positive.
Week 2:
But we have no way of knowing which ones are true positives and which ones aren’t. Due to chance, sometimes we might get 3 false positives, others 9.
In this example, we only see the 6 positive tests. So, the probability of having had COVID given a positive test is about 1 out of 6 (≈17%). Very low.
The math behind this (click to expand)
Bayes’ theorem
To illustrate and formalize this, we can use Bayes’ theorem:
$$P(\text{antibodies} \mid +) = \frac{P(+ \mid \text{antibodies}) \cdot P(\text{antibodies})}{P(+)}$$Where antibodies means really having antibodies, + means getting a positive test, and P(A|B) is the probability of A given B.4
To get the answer, we use our assumptions:
Numerator:
- \(P(\text{COVID}) = 0.01\) (1% of population infected)5
- \(P(+ \mid \text{COVID}) = 1\) (everyone with COVID tests positive)
Denominator:
We don’t know \(P(+)\) directly. But due to the law of total probability, we can express it as:
$$P(+) = P(+ \mid \text{COVID}) \cdot P(\text{COVID}) + P(+ \mid \lnot\text{COVID}) \cdot P(\lnot\text{COVID})$$- \(P(+ \mid \lnot\text{COVID}) = 0.05\) (false positive rate)
- \(P(\lnot\text{COVID}) = 0.99\) (complement of having COVID)
So now let’s replace everything:
$$P(\text{COVID} \mid +) = \frac{1 \times 0.01}{1 \times 0.01 + 0.05 \times 0.99} \approx 0.17$$After doing the antibody test and getting a positive result, there’s only a 17% chance you had COVID. The same result we got by counting people on COVIDFREE island.
One more problem
In the example above I used a 5% false positive rate. But we don’t really know this number exactly, at the time we knew it was probably between 3% to 11%.
This is problematic because, without knowing the exact false positive rate, it is even harder to know how many false positives we are seeing.
Then someone on the team asked: what if we use two different tests per person?
The idea is simple. If you test positive once, you might be a false positive. But if you test positive twice, with two independent tests, the odds shift. Both tests would have to give a false positive for the same person. That’s much less likely.
We ran the numbers. With two tests per person, we could distinguish between “probably infected” and “probably noise” much more reliably. The false positives didn’t disappear, but they became manageable.6
The role of Bayesian statistics.
But now, how do we account for all this in our estimates? We needed to:
- Properly account for the uncertainty on false positive and negative rates in both tests
- Be able to pool the information from both tests
I don’t know how to do this with a frequentist model, but with Bayesian statistics this all comes naturally. The math gets more involved, but the core insight is the same Bayes’ theorem we walked through, with uncertainty quantified at every step.
In practice, with Bayesian statistics you express the models with code using libraries such as pymc and stan (we used both for double checking our results).
Thanks to Bayesian statistics, we were able to tell policymakers that prevalence was far lower than raw test results suggested.
Without the Bayesian model, the false positives would have inflated the estimates by 5-10 times, making it look like the disease had already spread widely when it hadn’t.
That distinction mattered: it was the difference between assuming herd immunity was building and recognizing the population was still vulnerable.
This is called 100% sensitivity. ↩︎
This is 95% specificity. The best antibody tests at the time were around this level. ↩︎
This same issue happens with any medical test, so hopefully, after this post you will apply this logic to your own medical testing. ↩︎
This conditional probability notation reads as “the probability of A, given that B is true.” ↩︎
1% was a reasonable estimate early in the pandemic for many regions. ↩︎
The exact improvement depends on how independent the tests are. If both tests fail for the same biological reason, you don’t gain much. We used tests from different manufacturers targeting different antibodies, which helped. ↩︎